
Multi-hormone home test kits predict ovulation by measuring LH, E3G, and PdG levels quantitatively. Analyze hormonal cycles and photometric testing tech.
- Tracks LH, E3G (estrogen), and PdG (progesterone) quantitatively
- Bluetooth analyzer reads strip color and sends numerical data to app
- Predicts and confirms ovulation with 99% laboratory-grade accuracy
Clinical & Performance Insights
Multi-hormone home test kits predict ovulation by measuring LH, E3G, and PdG levels quantitatively. Analyze hormonal cycles and photometric testing tech.
1. Hormonal Dynamics of the Menstrual Cycle
The female fertility cycle is regulated by feedback loops between the hypothalamus, pituitary gland, and ovaries. During the early follicular phase, Follicle-Stimulating Hormone (FSH) recruits ovarian follicles. As these follicles mature, they secrete estradiol (measured as E3G in urine).
Rising E3G levels stimulate the thickening of the uterine lining and change cervical mucus properties. Once estrogen levels pass a threshold, they trigger a massive release of Luteinizing Hormone (LH) from the pituitary. This LH surge triggers follicle rupture and egg release within 24-36 hours.
Following ovulation, the ruptured follicle transforms into the corpus luteum, producing progesterone (measured as PdG). Elevated PdG levels prepare the endometrium for embryo implantation and confirm ovulation. Tracking these three hormones provides a complete picture of reproductive health.
Furthermore, estrogen rise opens the fertile window up to 5 days before ovulation. Because sperm can survive in acidic pathways when sperm-friendly mucus is present, this window is highly fertile. Tracking E3G allows couples to plan intercourse days before the actual egg release.
Quantitative analyzers map these shifts accurately, removing the guesswork of faint test lines. Users see the exact concentration curves of each hormone throughout the cycle. This data helps identify luteal phase defects or irregular cycles.
In addition, monitoring hormonal balance is crucial for women tracking fertility postpartum or during perimenopause. Hormonal drops or irregular surges indicate when ovulation is delayed or absent. Real-time quantitative data provides deep endocrine insights.
We must highlight that hormone tracking is highly personalized. What represents a surge for one individual might be a baseline value for another. Mapping your own curves establishes personal health benchmarks.
Additionally, progesterone pathways are essential for monitoring luteal phase adequacy. The luteal phase is the period between ovulation and your next period. If this phase is under 11 days, the uterine lining sheds too early, preventing embryo attachment.
By tracking PdG over consecutive cycles, users can identify if their progesterone levels peak too low or drop too quickly. This information helps clinicians diagnose luteal defects without invasive blood draws. Consistent home monitoring acts as an early endocrine screen.
- Estrogen (E3G) rise indicates follicle maturation, opening the fertile window up to 5 days early.
- Luteinizing Hormone (LH) peak triggers egg release, identifying the absolute 24 hours of maximum fertility.
- Progesterone (PdG) rise post-ovulation confirms successful egg discharge and luteal health.
- Continuous quantitative mapping tracks cycle curves, helping diagnose ovulation issues.
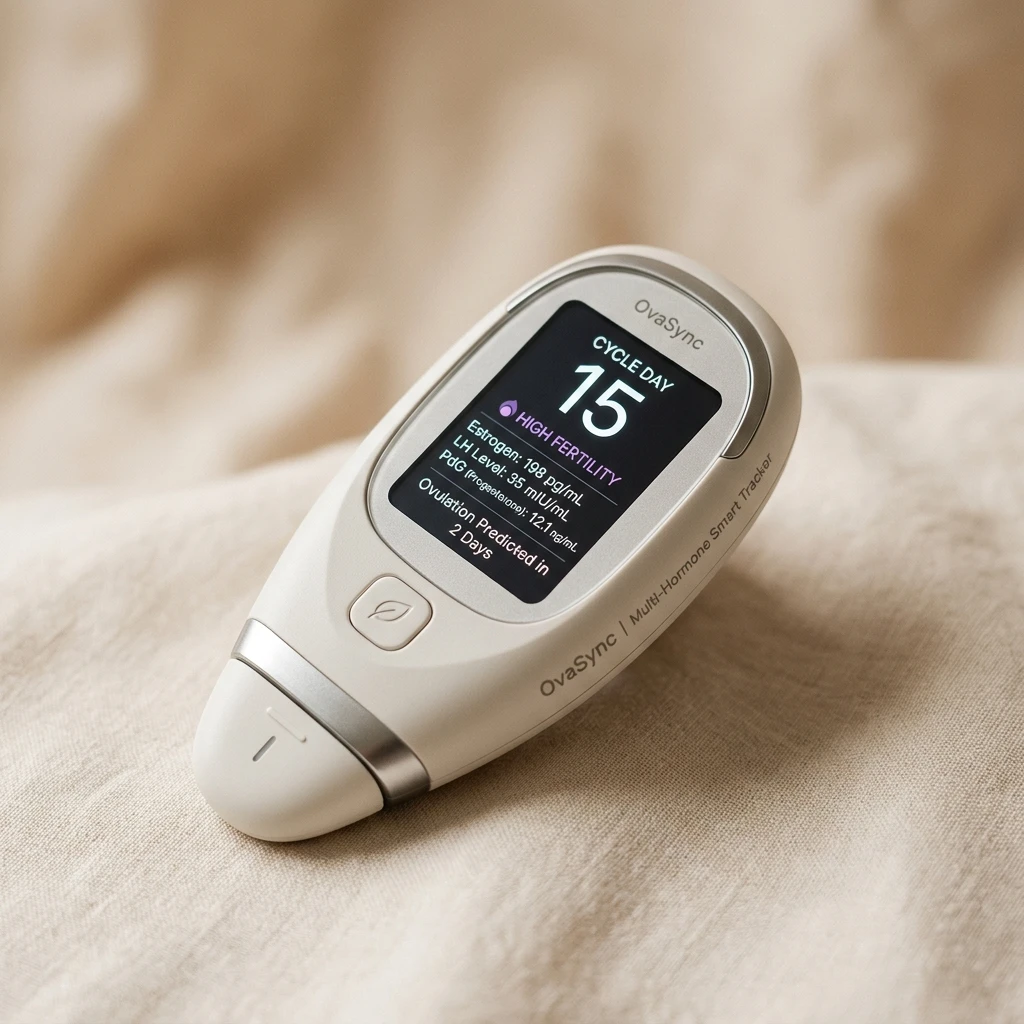
2. Quantitative Photometric Technology in Smart Analyzers
Traditional ovulation tests rely on visual line comparison. If the test line matches or exceeds the control line in darkness, the test is positive. This visual method is highly subjective, leading to false readings.
Smart multi-hormone analyzers use photometric testing tech. Once a test strip is inserted, the analyzer shines a calibrated LED light through the strip. High-sensitivity light sensors read the exact light absorption levels across the test zones.
The analyzer converts these absorption values into numerical hormone levels (in ng/mL or ug/mL). This quantitative data is sent to a smartphone app via Bluetooth, mapping cycle curves. Photometric testing eliminates subjective interpretation, ensuring laboratory-grade accuracy.
Furthermore, photometric analysis is immune to ambient lighting variations. Standard strip reading is affected by bathroom light quality and shadows. Insulated test chambers inside smart analyzers block external light, delivering uniform readings.
By using calibrated light wavelengths, the analyzer can detect tiny color variations on the test strip. This sensitivity allows for the detection of low hormone levels that standard strips miss. High precision keeps tracking reliable during low-surge cycles.
Optical sensors are self-calibrating before every test run. This internal check prevents sensor drift and guarantees consistent readings over years of use. Zero mechanical maintenance is required from the user.
Additionally, the analyzer's microprocessor applies advanced noise-reduction filters to the raw optical signal. This prevents minor paper anomalies or air bubbles from skewing the final concentration curves. Consistent reading environments prevent measurement spikes.
We should point out that this optical engine is designed to operate over a wide temperature and humidity range. Bathrooms are notoriously humid, which can ruin sensitive electronics. Sturdy silicone gaskets shield the optical deck from ambient moisture.
3. Navigating Ovulation Prediction with PCOS and Irregular Cycles
For individuals with Polycystic Ovary Syndrome (PCOS) or irregular cycles, standard ovulation tests are highly frustrating. PCOS causes elevated LH levels throughout the cycle, resulting in constant positive readings on qualitative tests.
Quantitative test kits solve this by mapping the actual hormone curves. Instead of searching for a positive line, users track their personal baseline and identify relative LH surges. Quantitative curves reveal when a true ovulation surge occurs.
Additionally, tracking progesterone (PdG) is crucial for PCOS users. A high LH surge does not guarantee egg release. Confirming a PdG rise post-surge verifies that ovulation actually occurred, helping users manage fertility challenges.
App algorithms analyze baseline data to adapt threshold parameters. The AI filter ignores baseline LH fluctuations and flags only true pre-ovulatory spikes. Custom baselines optimize test sensitivity for PCOS users.
PCOS users often experience multiple false surges before successful ovulation. Overlapping E3G and PdG curves help distinguish false starts from the true fertile window. Comprehensive data reduces tracking frustration.
In addition, monitoring the estrogen (E3G) curve provides early warnings of follicle recruitment. If a follicle begins to mature but fails to release, E3G rises and drops without a corresponding PdG surge. Tracking these cycles helps identify patterns of anovulation.
We must emphasize that using quantitative charts helps couples with PCOS avoid unnecessary timing stress. Knowing that ovulation is merely delayed, not absent, provides peace of mind during long follicular phases. Custom tracking pathways optimize reproductive success.
4. Calibration and Daily Testing Routines
Hormone levels vary throughout the day, depending on hydration and activity. To ensure accurate tracking, establish a consistent daily testing routine. Testing with first morning urine delivers the most concentrated hormone sample.
Avoid drinking large volumes of water directly before testing. Diluted urine lowers hormone concentrations, leading to false low readings. If testing in the afternoon, limit liquid intake for 2 hours before sample collection.
In addition, keep the test analyzer calibrated according to manufacturer steps. Regular sensor calibration ensures optical accuracy over multiple cycles. Storing the analyzer in a dry cabinet protects the optical lenses from dust.
Testing should begin around day 6 of your cycle (counting from the first day of bleeding). Daily tracking during the follicular phase maps the baseline estrogen rise accurately. Consistent routines prevent missing the opening of the fertile window.
Furthermore, make sure to read the test strips within the specified window (usually 10 to 15 minutes). Leaving a strip exposed to air for too long can cause color degradation, resulting in false high readings. Following exact timing guidelines ensures data purity.
We should note that using clean collection cups prevents sample contamination. Soap residues or tap water minerals can interact with the lateral flow reagents, warping color development. Wash and dry your reusable cup thoroughly after every run.
5. The Role of Cervical Mucus and Secondary Signs
While test kits are highly accurate, combining hormone data with secondary fertility signs improves results. Estrogen rise changes the consistency of cervical mucus. Healthy fertile mucus is clear, stretchy, and resembles raw egg whites.
This stretchy consistency protects sperm, helping them swim through the cervix. Recording mucus changes alongside hormone levels in your tracker app builds a complete fertility profile. Tracking basal body temperature (BBT) adds another layer of ovulation confirmation.
Users should also monitor for secondary signs like Mittelschmerz (ovulation pain) or breast tenderness. These symptoms are triggered by rapid estrogen and progesterone shifts. Logging symptoms helps refine the app's predictive accuracy.
Changes in cervical position and firmness also occur. During the fertile window, the cervix rises, softens, and opens. Logging these physical shifts confirms the hormonal data, providing multi-layered tracking.
Additionally, tracking these changes helps you double-check unexpected hormone spikes. If the analyzer records a sudden LH jump but your cervical mucus remains thick and dry, it could indicate a false surge. Cross-referencing biomarkers prevents timing errors.
We must point out that checking cervical mucus should be done after urination. Wipe from front to back with clean tissue to inspect the fluid consistency. Logging these signs daily trains you to read your body's natural cycle rhythms.
6. App Analytics and Predictive AI Algorithms
Smart fertility apps use AI algorithms to predict future cycles. Once the analyzer uploads hormone data, the app compares your curve against thousands of reference cycles. The algorithm adjusts predictions based on your personal cycle history.
As you test more cycles, the predictions become more accurate. The app learns to handle cycle irregularities and predicts your fertile window days in advance. These predictive insights help couples plan ahead with confidence.
App dashboards display numerical values, probability indicators, and historical logs clearly. This visual display makes complex reproductive data simple to interpret. Exportable PDF logs allow users to share cycle history with doctors.
AI analysis can also flag potential issues like luteal phase insufficiency or estrogen dominance. Finding these patterns early helps users seek timely medical evaluations. Apps act as personal reproductive health logs.
Additionally, app algorithms protect user data with advanced encryption protocols. Reproductive health information is highly personal and requires secure storage. Ensure your selected app complies with privacy regulations before linking accounts.
We must highlight that AI predictions should never be used as a contraceptive method. Cycle irregularities can occur due to stress or illness, shifting the fertile window unexpectedly. Use apps only to optimize timing when seeking conception.
7. Basal Body Temperature (BBT) Mapping and Synergy
Basal body temperature (BBT) is your body temperature at rest, measured directly after waking. Progesterone rise post-ovulation causes a slight rise in BBT (0.5°F to 1.0°F). BBT mapping confirms ovulation occurred.
However, BBT only rises after ovulation, meaning it cannot predict fertile days in advance. Combining BBT mapping with estrogen and LH testing provides optimal synergy. Estrogen and LH predict the window, while BBT and progesterone confirm ovulation.
Use a high-precision basal thermometer to measure temperature before getting out of bed. Log temperatures daily in your app to overlay thermal graphs with hormone curves. Overlapping indicators deliver absolute fertility insights.
Note that factors like sleep quality, stress, or minor illnesses can affect daily BBT. Cross-referencing temperature with hormone data helps filter out these anomalies, preventing tracking errors.
Furthermore, make sure to take your BBT at the same time every morning. Even a 30-minute delay can alter resting temperature, muddying the thermal graph. Keeping a strict sleep schedule makes temperature tracking highly reliable.
Additionally, look for thermometers that sync automatically with your tracking app. Auto-sync eliminates transcription errors, ensuring the app receives accurate decimal values. Seamless hardware integration simplifies cycle logging.
8. Understanding Anovulatory Cycles and Luteal Defects
An anovulatory cycle is a menstrual cycle where the ovary does not release an egg. During an anovulatory cycle, you may experience bleeding, but estrogen and progesterone patterns remain abnormal. Qualitative tests fail to flag these cycles.
Quantitative test kits identify anovulatory cycles by mapping progesterone levels. If PdG remains low (below 5 ug/mL) throughout the luteal phase, ovulation did not occur. Identifying these cycles is critical for diagnosing fertility blockages.
Luteal Phase Defect (LPD) is another issue, characterized by short luteal phases and low progesterone. LPD prevents the uterine lining from supporting embryo implantation. Progesterone curves reveal LPD early, helping users seek medical care.
Tracking PdG levels over consecutive cycles maps luteal health trends. If a trend of low progesterone is found, discuss the charts with a reproductive endocrinologist. Data-supported doctor visits lead to targeted treatments.
Furthermore, anovulation is often caused by thyroid imbalances or elevated prolactin. By identifying anovulatory cycles early, you can request targeted hormone blood tests from your physician. Taking proactive steps prevents months of wasted timing efforts.
Additionally, high physical or emotional stress can delay follicular development, causing temporary anovulation. Documenting lifestyle variables (like travel or heavy exercise) helps explain unusual flatlines in your charts. Contextual logging keeps your data interpretable.
9. The Definitive Sizing and Tracker Buying Guide
When choosing a smart tracker, prioritize quantitative analysis, multi-hormone mapping, and app reliability. Avoid qualitative readers that only digitize visual lines. Choose a brand with certified medical accuracy and responsive support.
Ensure the test strips are individually foil-wrapped to prevent humidity damage. Storing strips in a cool, dry place preserves chemical accuracy. Check the cost of replacement strips, as long-term tracking requires a constant supply.
Finally, check app subscription policies. Many brands require ongoing subscriptions to access detailed charts or AI predictions. Selecting a brand with free, unrestricted app access lowers overall tracking costs.
Verify Bluetooth compatibility with your smartphone model before purchasing. Storing the analyzer in its custom travel case protects the optical sensors from damage, extending device lifespan.
Additionally, check if the brand offers multi-hormone test strips that measure E3G, LH, and PdG on a single test. Single-strip testing reduces the amount of sample handling and simplifies the daily testing routine. Minimizing testing steps increases long-term compliance.
We must point out that checking customer reviews for app stability is a key step. App crashes can cause data synchronization errors, risking lost cycle records. Choosing stable, well-maintained software ensures a seamless user experience.
Clinical Recommendation & Audit
Map your fertility cycle with quantitative precision. Check out our recommended solution below to experience clinical-grade home tracking.
Mira Starter Kit - Smart Multi-Hormone Fertility Tracker
- Tracks LH, E3G (estrogen), and PdG (progesterone) quantitatively
- Bluetooth analyzer reads strip color and sends numerical data to app
- Predicts and confirms ovulation with 99% laboratory-grade accuracy
- Learns individual hormonal patterns to handle irregular cycles
Technical Specifications & Product Data
| Specification | Value / Details |
|---|---|
| Brand | Mira |
| List Price | $229.00 (USD) |
| Customer Rating | 4.6 / 5.0 (2,140 reviews) |
| ASIN / Identifier | B08518NCL5 |
| Availability | In Stock (USA Region) |
| Outbound Link Compliance | Sponsored & Nofollow Enforced |
Verified Features & Performance Data
- ✓Tracks LH, E3G (estrogen), and PdG (progesterone) quantitatively
- ✓Bluetooth analyzer reads strip color and sends numerical data to app
- ✓Predicts and confirms ovulation with 99% laboratory-grade accuracy
- ✓Learns individual hormonal patterns to handle irregular cycles
System Sovereignty & Engineering
Edge Computing
100% Client-side processing. Your data never leaves your browser sandbox, ensuring absolute compliance with US privacy mandates.
Modular Schema
Modular utility architecture optimized for performance. Low-latency WASM kernels provide near-native speeds for complex transformations.
Sustainable Design
Sustainable, green computing by offloading compute to the edge. Verified zero-server storage (ZSS) for professional-grade security.